Browse all guides
Understand your analytics dashboard
Read your Revenue, orders, and channel breakdown at a glance, over 7, 30, or 90 days.
- 1
Pick a date range
Go to Analytics and choose 7d, 30d, or 90d — each figure shows a percentage change against the equivalent prior period.

- 2
Check the headline numbers
Revenue, order count, and average order value sit at the top.

- 3
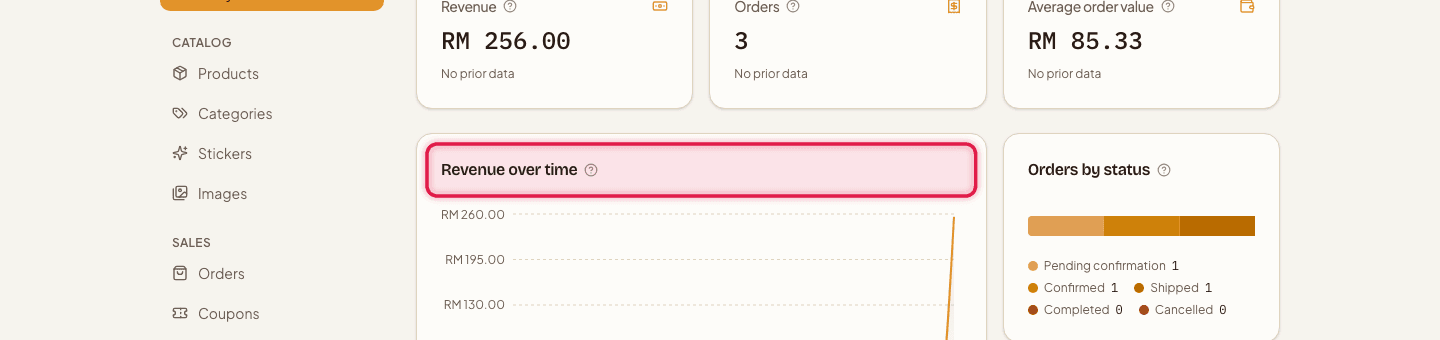
Read the trend chart
The revenue trend chart shows how sales moved over the selected period.
- 4
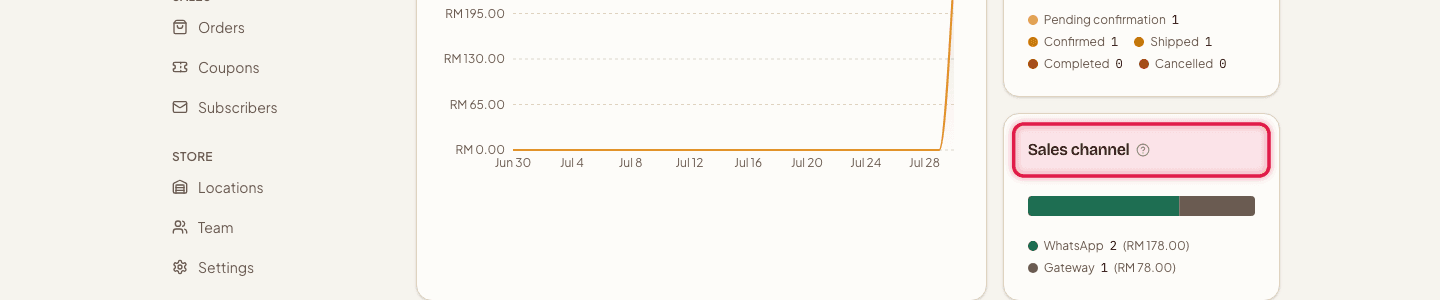
See where orders come from
The channel breakdown chart compares manually confirmed orders against online-payment orders.
- 5
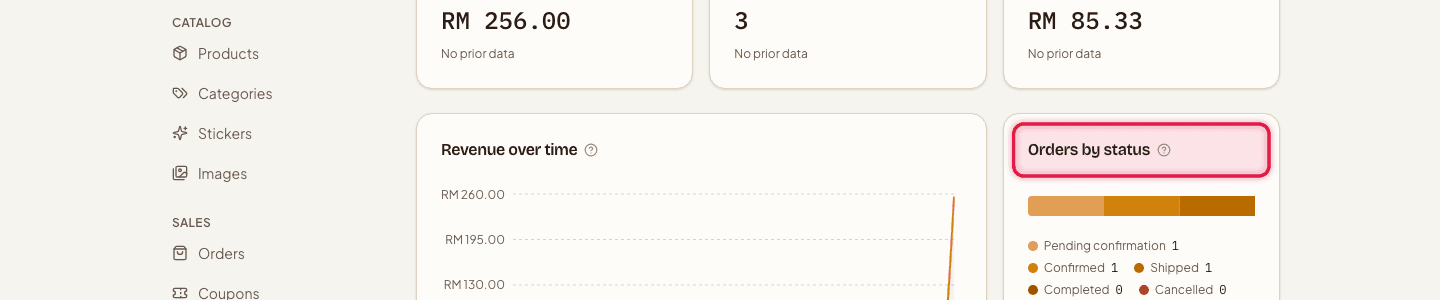
See order status mix
The order status breakdown shows how many orders sit in each of the 5 statuses.
- 6
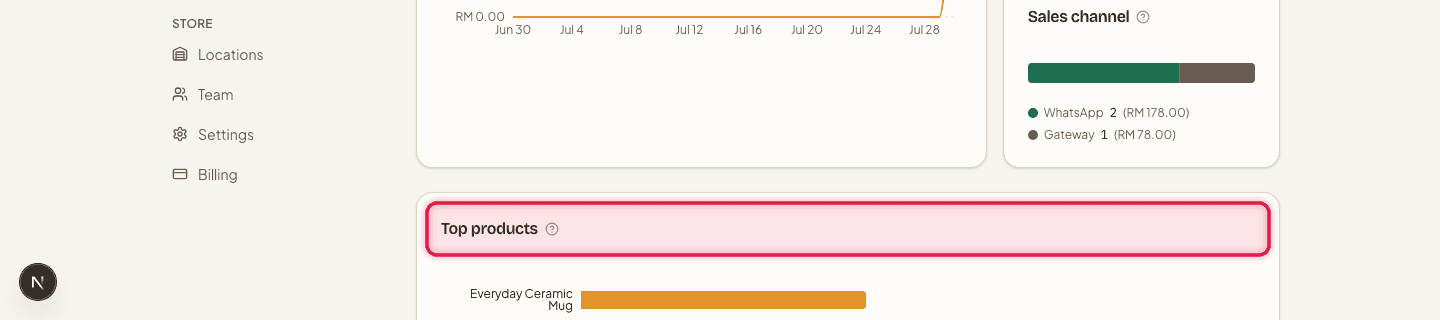
Spot your best sellers
The top products chart ranks what's actually selling.
Need units sold per product and option — for example, how many of each colour to restock? Tap "Units sold →" on the Top products card. You can filter by category, sort by units or revenue, and download the list as a CSV.
Analytics is included on every plan, from Free up to Pro.
Still stuck?
Contact us and we'll help you sort it out.